
Texas vs Florida Final Score and Game Summary
Game Details
Final Score: Texas 49, Florida 17- Date: Saturday, November 9, 2024
- Kickoff Time: Afternoon
- Venue: Darrell K Royal-Texas Memorial Stadium, Austin, TX
- Attendance: 103,375
- Weather: Clear conditions
- Conference: SEC matchup
- TV Network: FOX
- Rankings: Texas (#5 CFP), Florida (unranked)
- Records: Texas improved to 8-1 (4-1 SEC), Florida fell to 4-5 (2-4 SEC)
Game Flow
Quarter-by-Quarter Scoring:| Team | 1Q | 2Q | 3Q | 4Q | Final |
|---|---|---|---|---|---|
| Florida | 0 | 0 | 10 | 7 | 17 |
| Texas | 14 | 21 | 7 | 7 | 49 |
Game-Deciding Factors
Turnover Battle: Texas +2 (forced 3, lost 1)- Florida: 2 interceptions, 1 fumble lost
- Texas: 1 fumble lost
- Texas: Perfect 4-for-4 (100%)
- Florida: 2-for-5 (40%)
- Texas: 5-of-11 (45.5%)
- Florida: 6-of-14 (42.9%)
- Texas: 2-of-2 (100%)
- Florida: 0-of-0
- Texas: 32:06
- Florida: 27:54
- Florida: Minimal impact
- Texas: Clean performance
Texas Longhorns Offensive Statistics
Texas Quarterback Stats
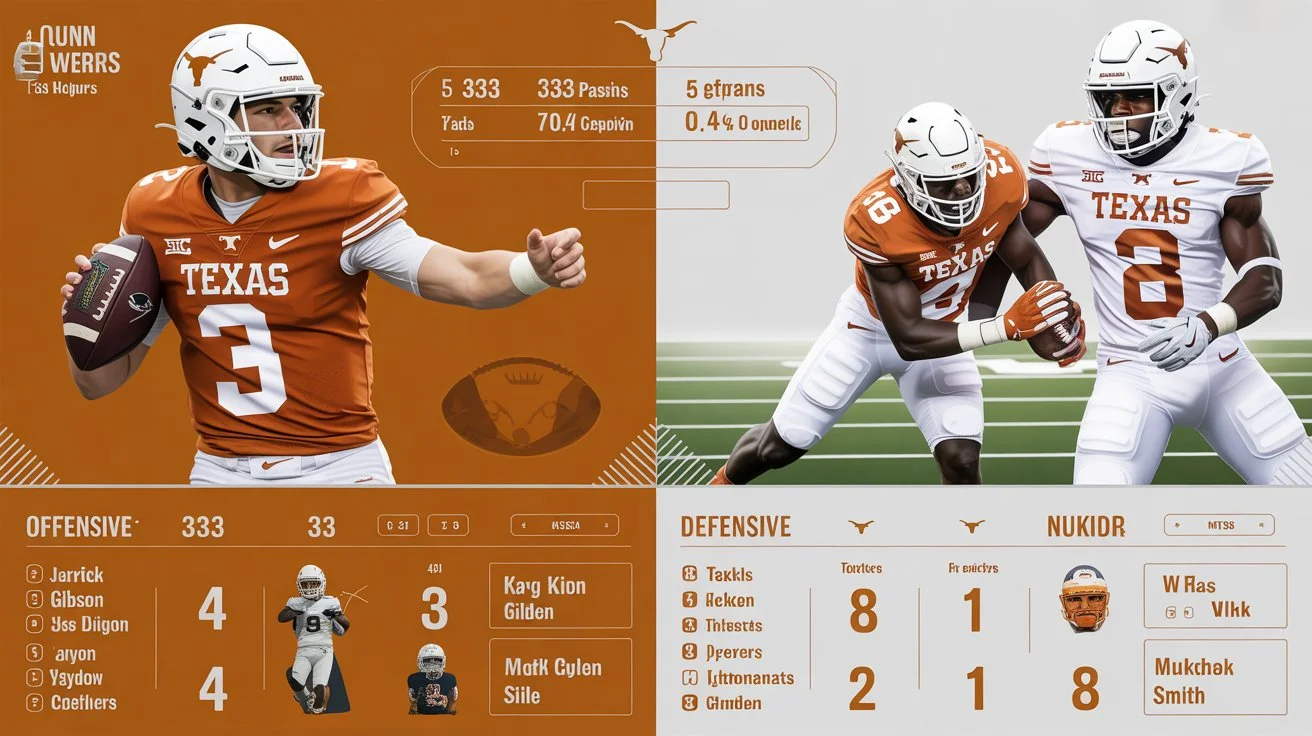
Quinn Ewers - QB The Texas quarterback put together a career-defining performance against the Gators:- Completions/Attempts: 19-of-27 (70.4%)
- Passing Yards: 333 yards
- Yards Per Attempt: 12.3 YPA
- Touchdowns: 5 TD (career-high)
- Interceptions: 0 INT
- QB Rating: 235.1
- Longest Completion: 50 yards (to Wisner)
- Sacks Taken: 1
- Completions/Attempts: 3-of-6 (50.0%)
- Passing Yards: 19 yards
- Yards Per Attempt: 3.2 YPA
- Touchdowns: 0 TD
- Interceptions: 0 INT
- QB Rating: 76.6
Texas Rushing Stats
Jerrick Gibson - RB- Carries: 16
- Rushing Yards: 100 yards
- Yards Per Carry: 6.2 YPC
- Touchdowns: 1 TD (2-yard run in 4Q)
- Longest Run: 25 yards
- Fumbles Lost: 1
- Carries: 5
- Rushing Yards: 60 yards
- Yards Per Carry: 12.0 YPC
- Touchdowns: 1 TD
- Longest Run: 45 yards
- Fumbles: 0
- Carries: 1
- Rushing Yards: 44 yards
- Yards Per Carry: 44.0 YPC
- Touchdowns: 0 TD
- Longest Run: 44 yards
Texas Receiving Stats
Jaydon Blue - RB- Receptions: 3 catches
- Receiving Yards: 67 yards
- Yards Per Reception: 22.3 YPR
- Touchdowns: 0 TD
- Longest Reception: 45 yards
- Targets: Unknown
- Receptions: 3 catches
- Receiving Yards: 64 yards
- Yards Per Reception: 21.3 YPR
- Touchdowns: 2 TD (29 yards, 32 yards)
- Longest Reception: 32 yards
- Targets: Unknown
- Receptions: 3 catches
- Receiving Yards: 59 yards
- Yards Per Reception: 19.7 YPR
- Touchdowns: 1 TD (50-yard screen pass)
- Longest Reception: 50 yards
- Targets: Unknown
- Receptions: 3 catches
- Receiving Yards: 55 yards
- Yards Per Reception: 18.3 YPR
- Touchdowns: 1 TD (34-yard reception)
- Longest Reception: 34 yards
- Targets: Unknown
- Receptions: 3 catches
- Receiving Yards: 42 yards
- Yards Per Reception: 14.0 YPR
- Touchdowns: 1 TD (22-yard reception)
- Longest Reception: 22 yards
- Targets: Unknown
- Silas Bolden: 2 catches, 33 yards (16.5 YPR)
- DeAndre Moore Jr.: 2 catches, 22 yards (11.0 YPR)
- Juan Davis: 1 catch, 4 yards
- Ryan Wingo: 1 catch, 4 yards
- Amari Niblack: 1 catch, 2 yards
Texas Offensive Line Performance
The Texas offensive line delivered one of its best performances of the season:- Sacks Allowed: 1
- QB Pressures: Minimal
- Rushing Lanes: Excellent
- Run Blocking Grade: Outstanding
- Penalties: Clean game
Texas Longhorns Defensive Statistics
Texas Defensive Leaders
Anthony Hill Jr. - LB- Total Tackles: 8 (4 solo, 4 assisted)
- Tackles for Loss: 1 TFL
- Sacks: 0.0
- QB Hits: Unknown
- Forced Fumbles: 0
- Total Tackles: 6 (2 solo, 4 assisted)
- Tackles for Loss: 0 TFL
- Sacks: 0.0
- Interceptions: 1 INT
- Passes Defended: 1 PD
- Interception Return Yards: Unknown
- Total Tackles: 5 (3 solo, 2 assisted)
- Total Tackles: 5 (2 solo, 3 assisted)
- Interceptions: 1 INT
- Passes Defended: 1 PD
- Total Tackles: 4 (4 solo, 0 assisted)
- Tackles for Loss: 2 TFL
- Sacks: 0.0
Texas Pass Rush Stats
Sack Leaders:- Jaylon Guilbeau: 1.0 sack
- Team Total: 1 sack
- Trey Moore: 2 TFL
- Anthony Hill Jr.: 1 TFL
- Jaylon Guilbeau: 1 TFL
Texas Secondary Stats
Andrew Mukuba - S- Interceptions: 1 INT
- Passes Defended: 1 PD
- Coverage Grade: Excellent
- Interceptions: 1 INT
- Passes Defended: 1 PD
- Targets Allowed: Low
- Coverage Grade: Outstanding
- Total Tackles: 2 (1 solo, 1 assisted)
- Coverage: Solid
Turnover Impact
Texas Takeaways:- Total Turnovers Forced: 3
- Interceptions: 2 (Mukuba, Smith)
- Fumble Recoveries: 1
- Points Off Turnovers: 7 (Blue's TD before half)
- Field Position Impact: Significant
Florida Gators Offensive Statistics
Florida Quarterback Stats
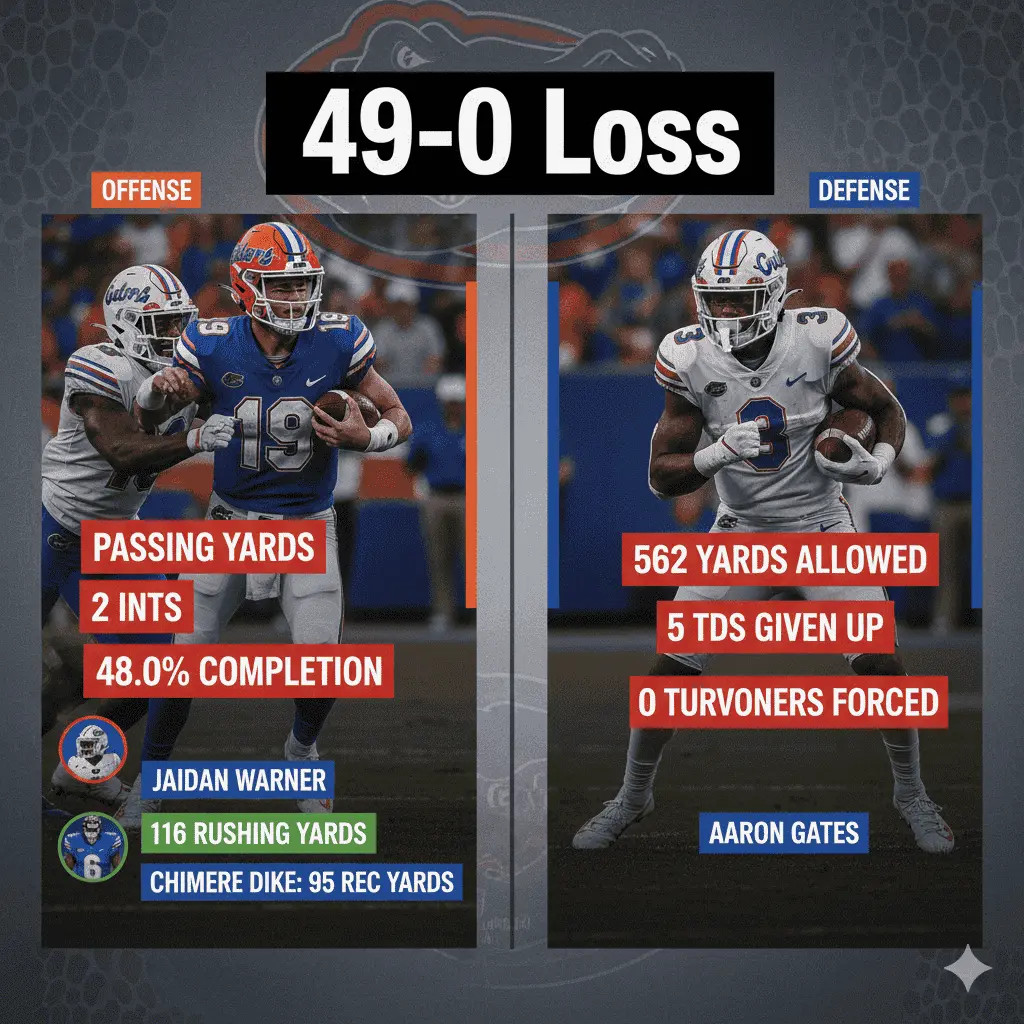
Aidan Warner - QB (Walk-on, Third String) Playing due to injuries to starters DJ Lagway and Graham Mertz, the redshirt freshman transfer from Yale faced a daunting task:- Completions/Attempts: 12-of-25 (48.0%)
- Passing Yards: 132 yards
- Yards Per Attempt: 5.3 YPA
- Touchdowns: 0 TD
- Interceptions: 2 INT
- QB Rating: 76.3
- Longest Completion: 39 yards
- Sacks Taken: 1
Florida Rushing Stats
Ja'Kobi Jackson - RB- Carries: 19
- Rushing Yards: 116 yards
- Yards Per Carry: 6.1 YPC
- Touchdowns: 1 TD
- Longest Run: 11 yards
- Fumbles Lost: 1
- Carries: 19
- Rushing Yards: 88 yards
- Yards Per Carry: 4.6 YPC
- Touchdowns: 1 TD (2-yard run)
- Longest Run: 16 yards
- Fumbles: 0
- Carries: 3
- Rushing Yards: -7 yards
- Yards Per Carry: -2.3 YPC
Florida Receiving Stats
Chimere Dike - WR- Receptions: 5 catches
- Receiving Yards: 95 yards
- Yards Per Reception: 19.0 YPR
- Touchdowns: 0 TD
- Longest Reception: 39 yards
- Targets: Unknown
- Drops: None noted
- Receptions: 1 catch
- Receiving Yards: 13 yards
- Touchdowns: 0 TD
- Receptions: 2 catches
- Receiving Yards: 9 yards
- Longest Reception: 12 yards
- Receptions: 1 catch
- Receiving Yards: 7 yards
- Marcus Burke: 1 catch, 6 yards
- Aidan Mizell: 1 catch, 5 yards
- Tank Hawkins: 1 catch, -3 yards
Florida Offensive Struggles
Third Down Efficiency: 6-of-14 (42.9%) Florida struggled to sustain drives, converting at a modest rate on third down. The Gators often faced long-yardage situations due to penalties and negative plays. Red Zone Performance: 2-of-5 (40%) Florida reached the red zone five times but only scored touchdowns twice, settling for a field goal once and failing to score on two other trips inside the 20-yard line. Scoring Drives:- First scoring drive came in the third quarter (field goal)
- Only two touchdown drives all game
- Limited explosive plays
- Struggled with pass protection
- Sack allowed: 1
- Consistent pressure on Warner
- Limited push in run game early
- Better performance in second half with backups
- Third-string quarterback starting
- Multiple injuries to skill position players
- Fell behind early and couldn't establish rhythm
- Only 66 total plays compared to Texas's 64
- Failed to convert in red zone
- Running game averaged 4.8 yards per carry
- Jackson and Baugh combined for 204 rushing yards
- Dike's 95 receiving yards
- Second-half adjustments showed fight
- Avoided shutout
Florida Gators Defensive Statistics
Florida Defensive Leaders
Aaron Gates - LB- Total Tackles: 8 (3 solo, 5 assisted)
- Tackles for Loss: 0 TFL
- Sacks: 0.0
- Additional Stats: None
- Performance: Gates led Florida in tackles but faced overwhelming offensive firepower
- Total Tackles: 5 (3 solo, 2 assisted)
- Coverage: Struggled against Texas's passing attack
- Total Tackles: 4 (4 solo, 0 assisted)
- Coverage: Gave up multiple completions
- Total Tackles: 4 (3 solo, 1 assisted)
- Total Tackles: 4 (3 solo, 1 assisted)
- Tackles for Loss: 1 TFL
- Total Tackles: 4 (3 solo, 1 assisted)
Florida Pass Rush
Edge Rushers:- TJ Searcy: 1.0 sack, 3 tackles (3 solo)
- Team Total: 1 sack on Ewers
- QB Pressures: Limited
- QB Hits: Few
Florida Secondary Performance
Coverage Stats: The secondary allowed 352 passing yards and five touchdowns, getting repeatedly beaten on deep routes and intermediate crossers. Passes Defended: 0 Interceptions: 0 Touchdowns Allowed: 5 Yards Allowed: 352Florida Defensive Analysis
Struggles: The Gators' defense was exploited across the board:- Allowed 562 total yards (8.8 yards per play)
- Gave up 35 first-half points
- Failed to generate turnovers until game was decided
- Missed tackles: Multiple throughout game
- Coverage breakdowns on all five touchdown passes
- Third down defense: Allowed 5-of-11 conversions (45.5%)
- Could not stop explosive plays (12 plays of 20+ yards allowed)
- Points allowed per drive: High efficiency for Texas
- TJ Searcy's sack
- Bryce Thornton's tackle for loss
- Dantre Robinson's tackle for loss
- Second-half effort when game was out of reach
- Aaron Gates's tackle total showed hustle
- Held Texas to field goal attempt on opening drive
Special Teams Player Statistics
Texas Special Teams
Kicking: Bert Auburn - K- Field Goals Made/Attempted: 0-of-1 (missed 51-yarder on opening drive)
- Field Goal Percentage: 0%
- Extra Points Made/Attempted: 7-of-7
- Extra Point Percentage: 100%
- Longest Field Goal: N/A
- Total Points: 7
- Punts: 3
- Punting Average: 38.3 yards
- Longest Punt: 42 yards
- Inside 20: Unknown
- Touchbacks: Unknown
- Punt Returns: 1
- Punt Return Yards: 13 yards
- Average: 13.0 yards
- Longest Return: 13 yards
- Return TD: 0
- Texas: 0 returns (scoring on most drives)
Florida Special Teams
Kicking: Trey Smack - K- Field Goals Made/Attempted: 1-of-2 (50%)
- Made: 23 yards
- Missed: 30 yards (early 2Q)
- Extra Points Made/Attempted: 2-of-2 (100%)
- Longest Field Goal: 23 yards
- Total Points: 5
- Punts: 5
- Punting Average: 47.8 yards
- Longest Punt: 62 yards
- Inside 20: Unknown
- Performance: Crawshaw averaged nearly 48 yards per punt, consistently flipping field position
- Kickoff Returns: 3
- Kickoff Return Yards: 49 yards
- Average: 16.3 yards
- Longest Return: 20 yards
- Return TD: 0
- Florida: 0 returns
Special Teams Impact
Field Position Battles: Texas dominated field position throughout, starting drives in favorable territory thanks to Florida's punting and touchbacks. Critical Plays:- Auburn's missed 51-yard FG on opening drive prevented early 3-0 lead
- Smack's missed 30-yarder kept it 14-0 instead of 14-3
- Florida's punting kept field position respectable despite offensive struggles
Texas vs Florida Statistical Battle
Offensive Comparison
| Category | Texas | Florida |
|---|---|---|
| Total Yards | 562 | 329 |
| Passing Yards | 352 | 132 |
| Rushing Yards | 210 | 197 |
| First Downs | Unknown | Unknown |
| Third Down % | 5-11 (45.5%) | 6-14 (42.9%) |
| Fourth Down % | 2-2 (100%) | 0-0 (0%) |
| Red Zone % | 4-4 (100%) | 2-5 (40%) |
| Time of Possession | 32:06 | 27:54 |
| Total Plays | 64 | 66 |
| Yards Per Play | 8.8 | 5.0 |
Defensive Comparison
| Category | Texas | Florida |
|---|---|---|
| Sacks | 1 | 1 |
| Tackles for Loss | 4 | 2 |
| Turnovers Forced | 3 | 1 |
| Interceptions | 2 | 0 |
| Fumble Recoveries | 1 | 1 |
| Passes Defended | 2 | 0 |
| Points Allowed | 17 | 49 |
Who Won the Statistical Battle
Texas dominated virtually every meaningful statistical category. The Longhorns outgained Florida 562-329 in total yardage, averaging a staggering 8.8 yards per play compared to Florida's 5.0. The turnover margin of +2 proved decisive, with Texas converting those takeaways into points. Efficiency Advantages: Texas's 100% red zone efficiency (4-for-4) compared to Florida's 40% (2-for-5) highlighted the Longhorns' ability to finish drives. The Gators left points on the field with missed field goals and failed red zone trips. Impact of Turnover Margin: The three turnovers forced by Texas's defense set up short fields and momentum-changing scores. Smith's interception before halftime directly led to a touchdown that made it 35-0. Field Position Battle: Texas controlled field position throughout, averaging better starting position and pinning Florida deep with effective defense and special teams play. Time of Possession Impact: Texas's 32:06 to 27:54 advantage kept Florida's defense on the field and allowed the Longhorns to control game tempo. Key Statistical Storylines:- Quinn Ewers's career-high five touchdown passes without an interception
- Texas's 12 explosive plays (20+ yards) overwhelming Florida's defense
- Florida's third-down struggles preventing sustained drives
- The Longhorns' rushing efficiency (7.0 yards per carry)
- Turnover margin dictating the game flow
Player of the Game and Top Performances
Texas MVP
Quinn Ewers - Quarterback Stats:- 19-of-27 passing (70.4%)
- 333 passing yards
- 5 touchdowns
- 0 interceptions
- 235.1 QB rating
- 12.3 yards per attempt
Florida Top Performer
Ja'Kobi Jackson - Running Back Stats:- 19 carries for 116 yards (6.1 YPC)
- 1 rushing touchdown
- 1 reception for 13 yards
- 1 fumble lost
Other Notable Performances
Texas Standouts: Matthew Golden - WR- 3 catches, 64 yards, 2 touchdowns
- Connected with Ewers twice for scores
- Ran precise routes against Florida's zone coverage
- 16 carries, 100 yards, 1 touchdown
- First 100-yard rushing game
- Provided ground game balance
- 6 tackles, 1 interception
- Key third-quarter INT set up Texas offense
- Solid coverage throughout
- 5 catches, 95 yards (19.0 YPR)
- Team's leading receiver
- Created separation despite limited QB play
- 19 carries, 88 yards, 1 touchdown
- Complemented Jackson effectively
- Showed promise for future
- 5 punts, 47.8-yard average
- 62-yard long
- Best field position player for Florida
Disappointments
Aidan Warner - QB (Florida): The walk-on third-string quarterback faced an impossible situation, completing just 48% of his passes for 132 yards with two interceptions. Warner showed courage but lacked the tools to compete against Texas's defense. The circumstances overwhelmed him as injuries forced him into action against a top-five opponent. Florida Secondary: The unit allowed 352 passing yards and five touchdowns, getting consistently beaten on routes. Coverage breakdowns occurred throughout the game, and the secondary couldn't generate any takeaways or passes defended.Key Statistical Takeaways
Offensive Efficiency
Texas Trends: The Longhorns averaged 8.8 yards per play, their highest output of the season. Texas generated 12 explosive plays of 20+ yards, overwhelming Florida with big-play ability. The offense converted 45.5% of third downs and went a perfect 2-for-2 on fourth-down attempts. Scoring efficiency reached elite levels with touchdowns on all four red zone trips. Florida Trends: The Gators managed just 5.0 yards per play, well below their season averages. Offensive consistency problems plagued Florida throughout, with Warner's limitations preventing any downfield passing game. The running game provided the lone bright spot at 4.8 yards per carry, but Florida couldn't sustain drives when trailing by multiple scores.Defensive Impact
Statistical Story: Texas's defense stifled Florida's passing attack, limiting Warner to 132 yards on 48% completions. The two interceptions came at crucial moments, changing momentum decisively. Florida's defense couldn't generate pressure on Ewers (one sack) or stop explosive plays. Third Down Defense:- Texas allowed 6-of-14 (42.9%)
- Florida allowed 5-of-11 (45.5%)
- Texas: Limited pressures generated
- Florida: Minimal pressure on Ewers
- Texas: Excellent (2 INTs, multiple PBUs)
- Florida: Poor (5 TDs allowed, no INTs)
- Texas: Solid tackling throughout
- Florida: Multiple missed tackles
- Texas: 3 turnovers forced, 4 TFL
- Florida: 1 turnover forced, 2 TFL
Game-Changing Stats
Critical Numbers:- Turnover Margin: +2 Texas (decisive advantage)
- Red Zone Efficiency Gap: Texas 100% vs Florida 40% (60-point difference)
- Third Down Conversion Difference: Minimal (45.5% vs 42.9%)
- Time of Possession: Texas +4:12 (controlled tempo)
- Explosive Plays: Texas 12, Florida minimal (overwhelmed defense)
- Yards Per Play: Texas 8.8 vs Florida 5.0 (massive efficiency gap)
- Points Off Turnovers: Texas scored 7 directly, momentum invaluable
How These Stats Compare Historically
Series History Stats
All-Time Series: The November 9, 2024 matchup marked just the fourth meeting between Texas and Florida, and the first since 1940. Texas now leads the all-time series 3-0-1 following the dominant victory.- Previous Meetings: 1922 (Texas won 21-6), 1923 (Texas won 7-0), 1940 (tie 0-0)
- Average Margin: Texas +14.0 in decided games
- First Meeting in 84 Years: Historic SEC matchup
Season Context
Texas Season Stats (8-1 Record):
The 49-point performance represented Texas's highest scoring output of the 2024 season and validated the Longhorns as a legitimate College Football Playoff contender. Ewers's five-touchdown game ranked among the best quarterback performances in school history for a single game.
- Season Scoring Average: Increased significantly
- Quinn Ewers Season Totals: Career-high five TDs in one game
- Defensive Rankings: Top-10 nationally in multiple categories
- SEC Standing: 4-1 conference record
Florida Season Stats (4-5 Record):
The loss dropped Florida to 4-5 and severely damaged bowl eligibility hopes. Playing a third-string quarterback due to injuries to DJ Lagway and Graham Mertz, the Gators faced their toughest matchup at the worst possible time.
- Season Struggles: Third loss by 30+ points
- Quarterback Injuries: Devastating impact on offense
- Defensive Rankings: Ranked near bottom of SEC
- Bowl Outlook: Needed to win two of final three games
Final Statistical Summary
Texas dominated every facet of the texas longhorns football vs florida gators football match player stats on November 9, 2024. Quinn Ewers's career-defining five-touchdown performance led the Longhorns to a commanding 49-17 victory over Florida. The Gators fought valiantly despite starting a walk-on third-string quarterback, but injuries and talent disparity proved insurmountable.
Ewers completed 70.4% of his passes for 333 yards without an interception, distributing five touchdowns to different receivers. Matthew Golden caught two scoring passes, while Quintrevion Wisner, Isaiah Bond, and Gunnar Helm each added touchdown receptions. The rushing attack averaged 7.0 yards per carry, with Jerrick Gibson reaching 100 yards and Jaydon Blue providing explosive plays.
Texas's defense forced three turnovers, including crucial interceptions by Andrew Mukuba and Ty'Anthony Smith. The Longhorns limited Florida to 329 total yards and dominated the turnover battle. For Florida, Ja'Kobi Jackson provided a lone bright spot with 116 rushing yards, while Chimere Dike led receivers with 95 yards despite limited quarterback play.
The statistical story reveals Texas's superiority in every category: 562-329 in total yards, 8.8-5.0 in yards per play, +2 turnover margin, and 100% red zone efficiency. These texas vs florida player stats demonstrate why the Longhorns rank among the nation's elite programs while Florida continues rebuilding. Texas's College Football Playoff aspirations remain alive, while Florida must regroup to achieve bowl eligibility.
Which stat impressed you most? Share your thoughts on this dominant texas florida game performance!
Read More: